
Sage: A Conversational Layer for Petavue's Analytics
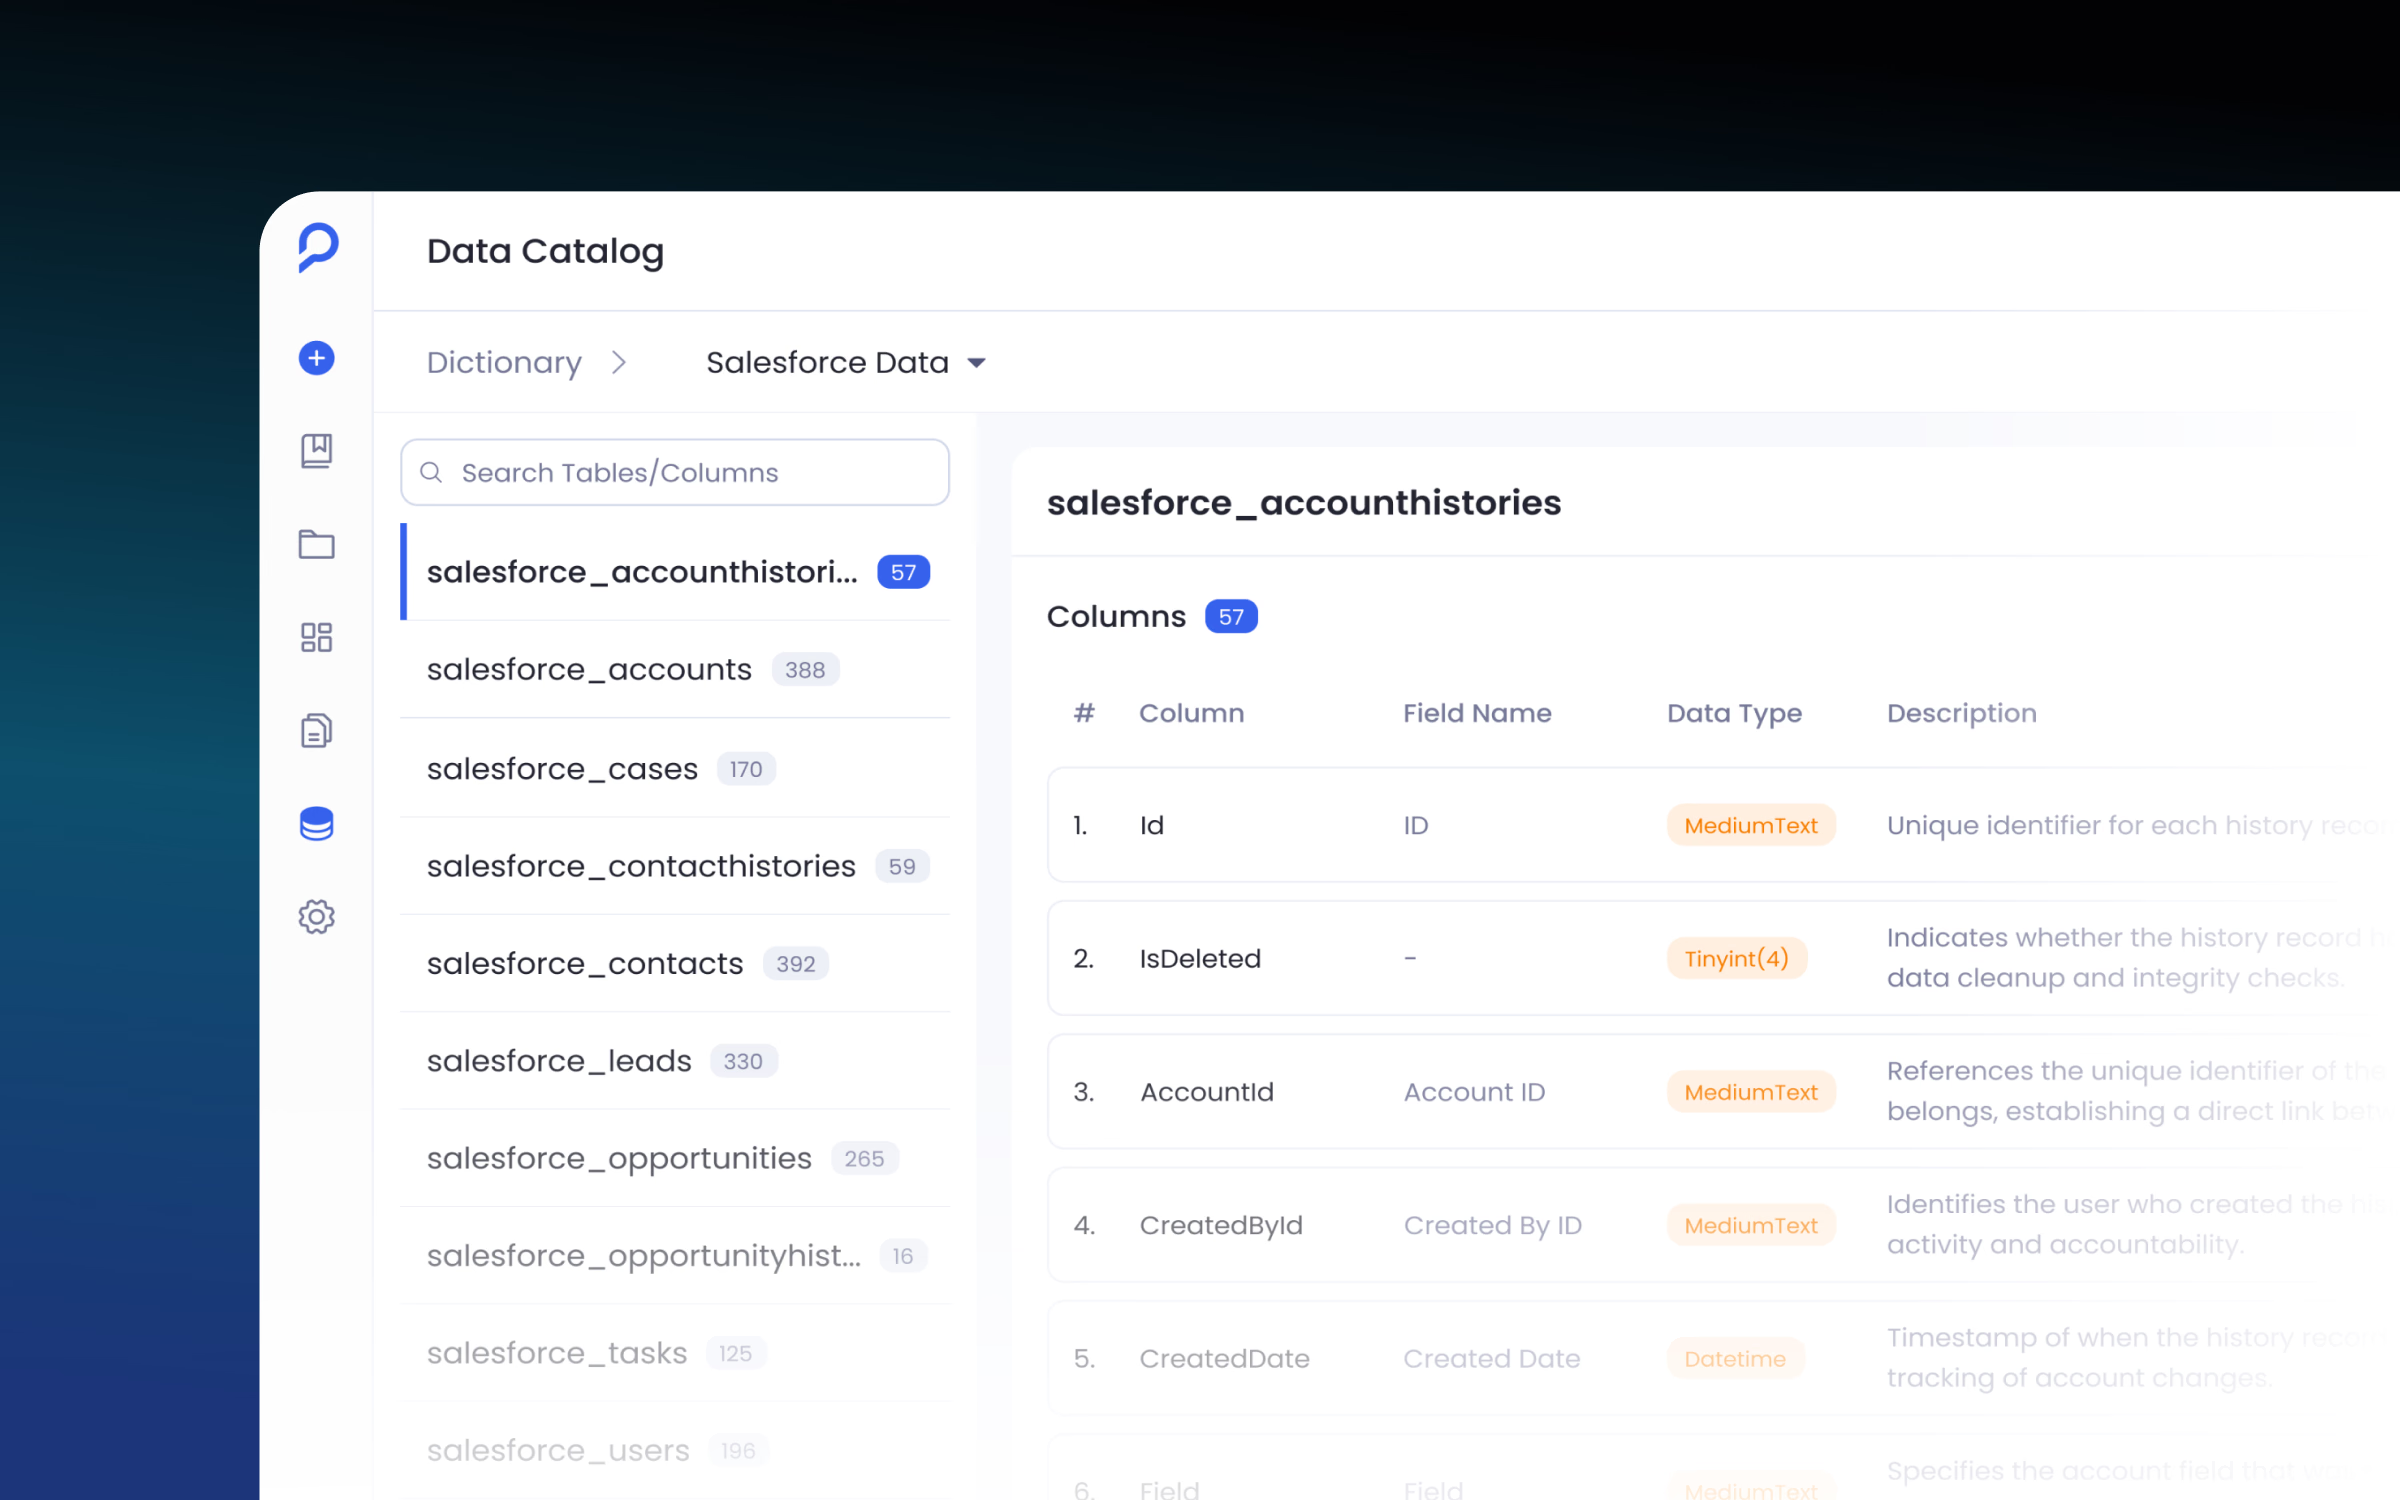
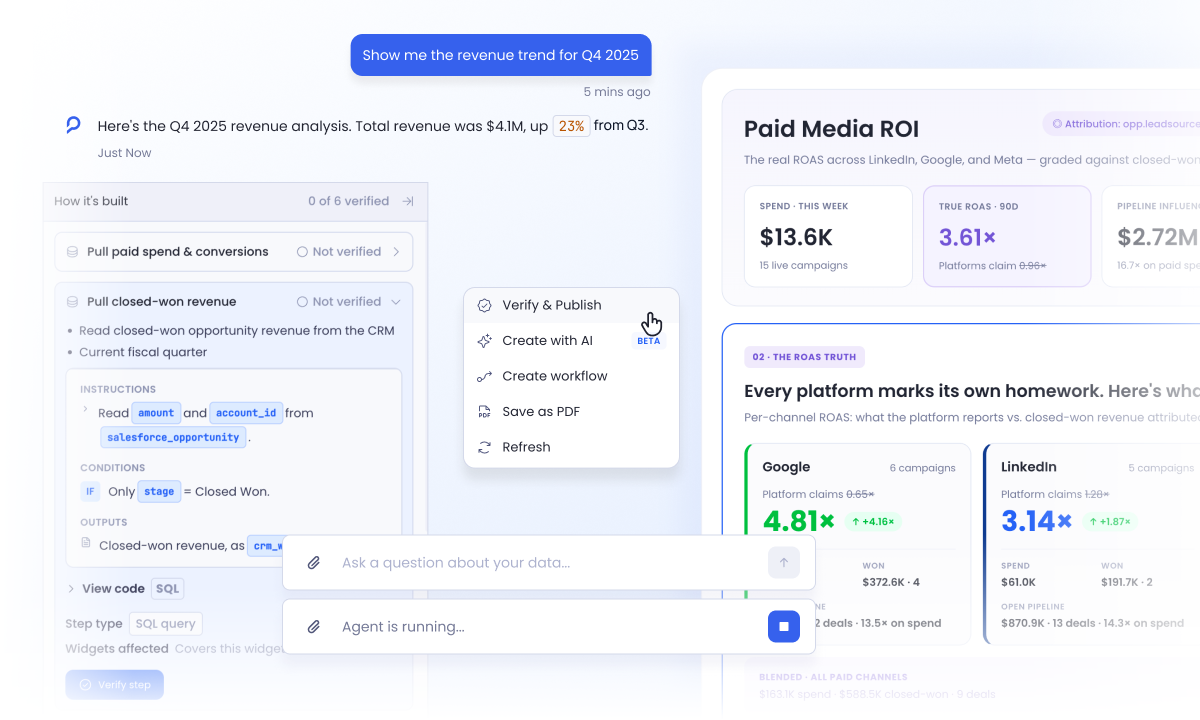
Petavue connects data from sources that don't normally talk to each other. I designed Sage, Petavue's in-house agent, which works as a conversational layer on top. You ask a question in plain language from whatever you're working on, and it reasons across the connected sources to find you an answer.
Results
- A conversational layer across the product: Sage answers plain-language questions about any connected dashboard, from wherever a user is already working.
- Interaction built before the UI was polished: a fully working React prototype, built in Claude Code with the design system I built in Figma, tested streaming, clarification, and context handling early.
- Answers built for decisions, not chat: every response is structured around what happened, what supports it, and what to do next.
- AI reasoning stays verifiable: answers come in plain language, so any user can jump right in and understand them. The technical execution sits underneath for anyone who wants to check it.
One experience across different contexts
Sage is a chat interface that lives across different modules of the product. It's the first thing you see when you open Petavue, right on the homepage. The same interface had to show up in other parts of the product too, and the first of those was dashboards.
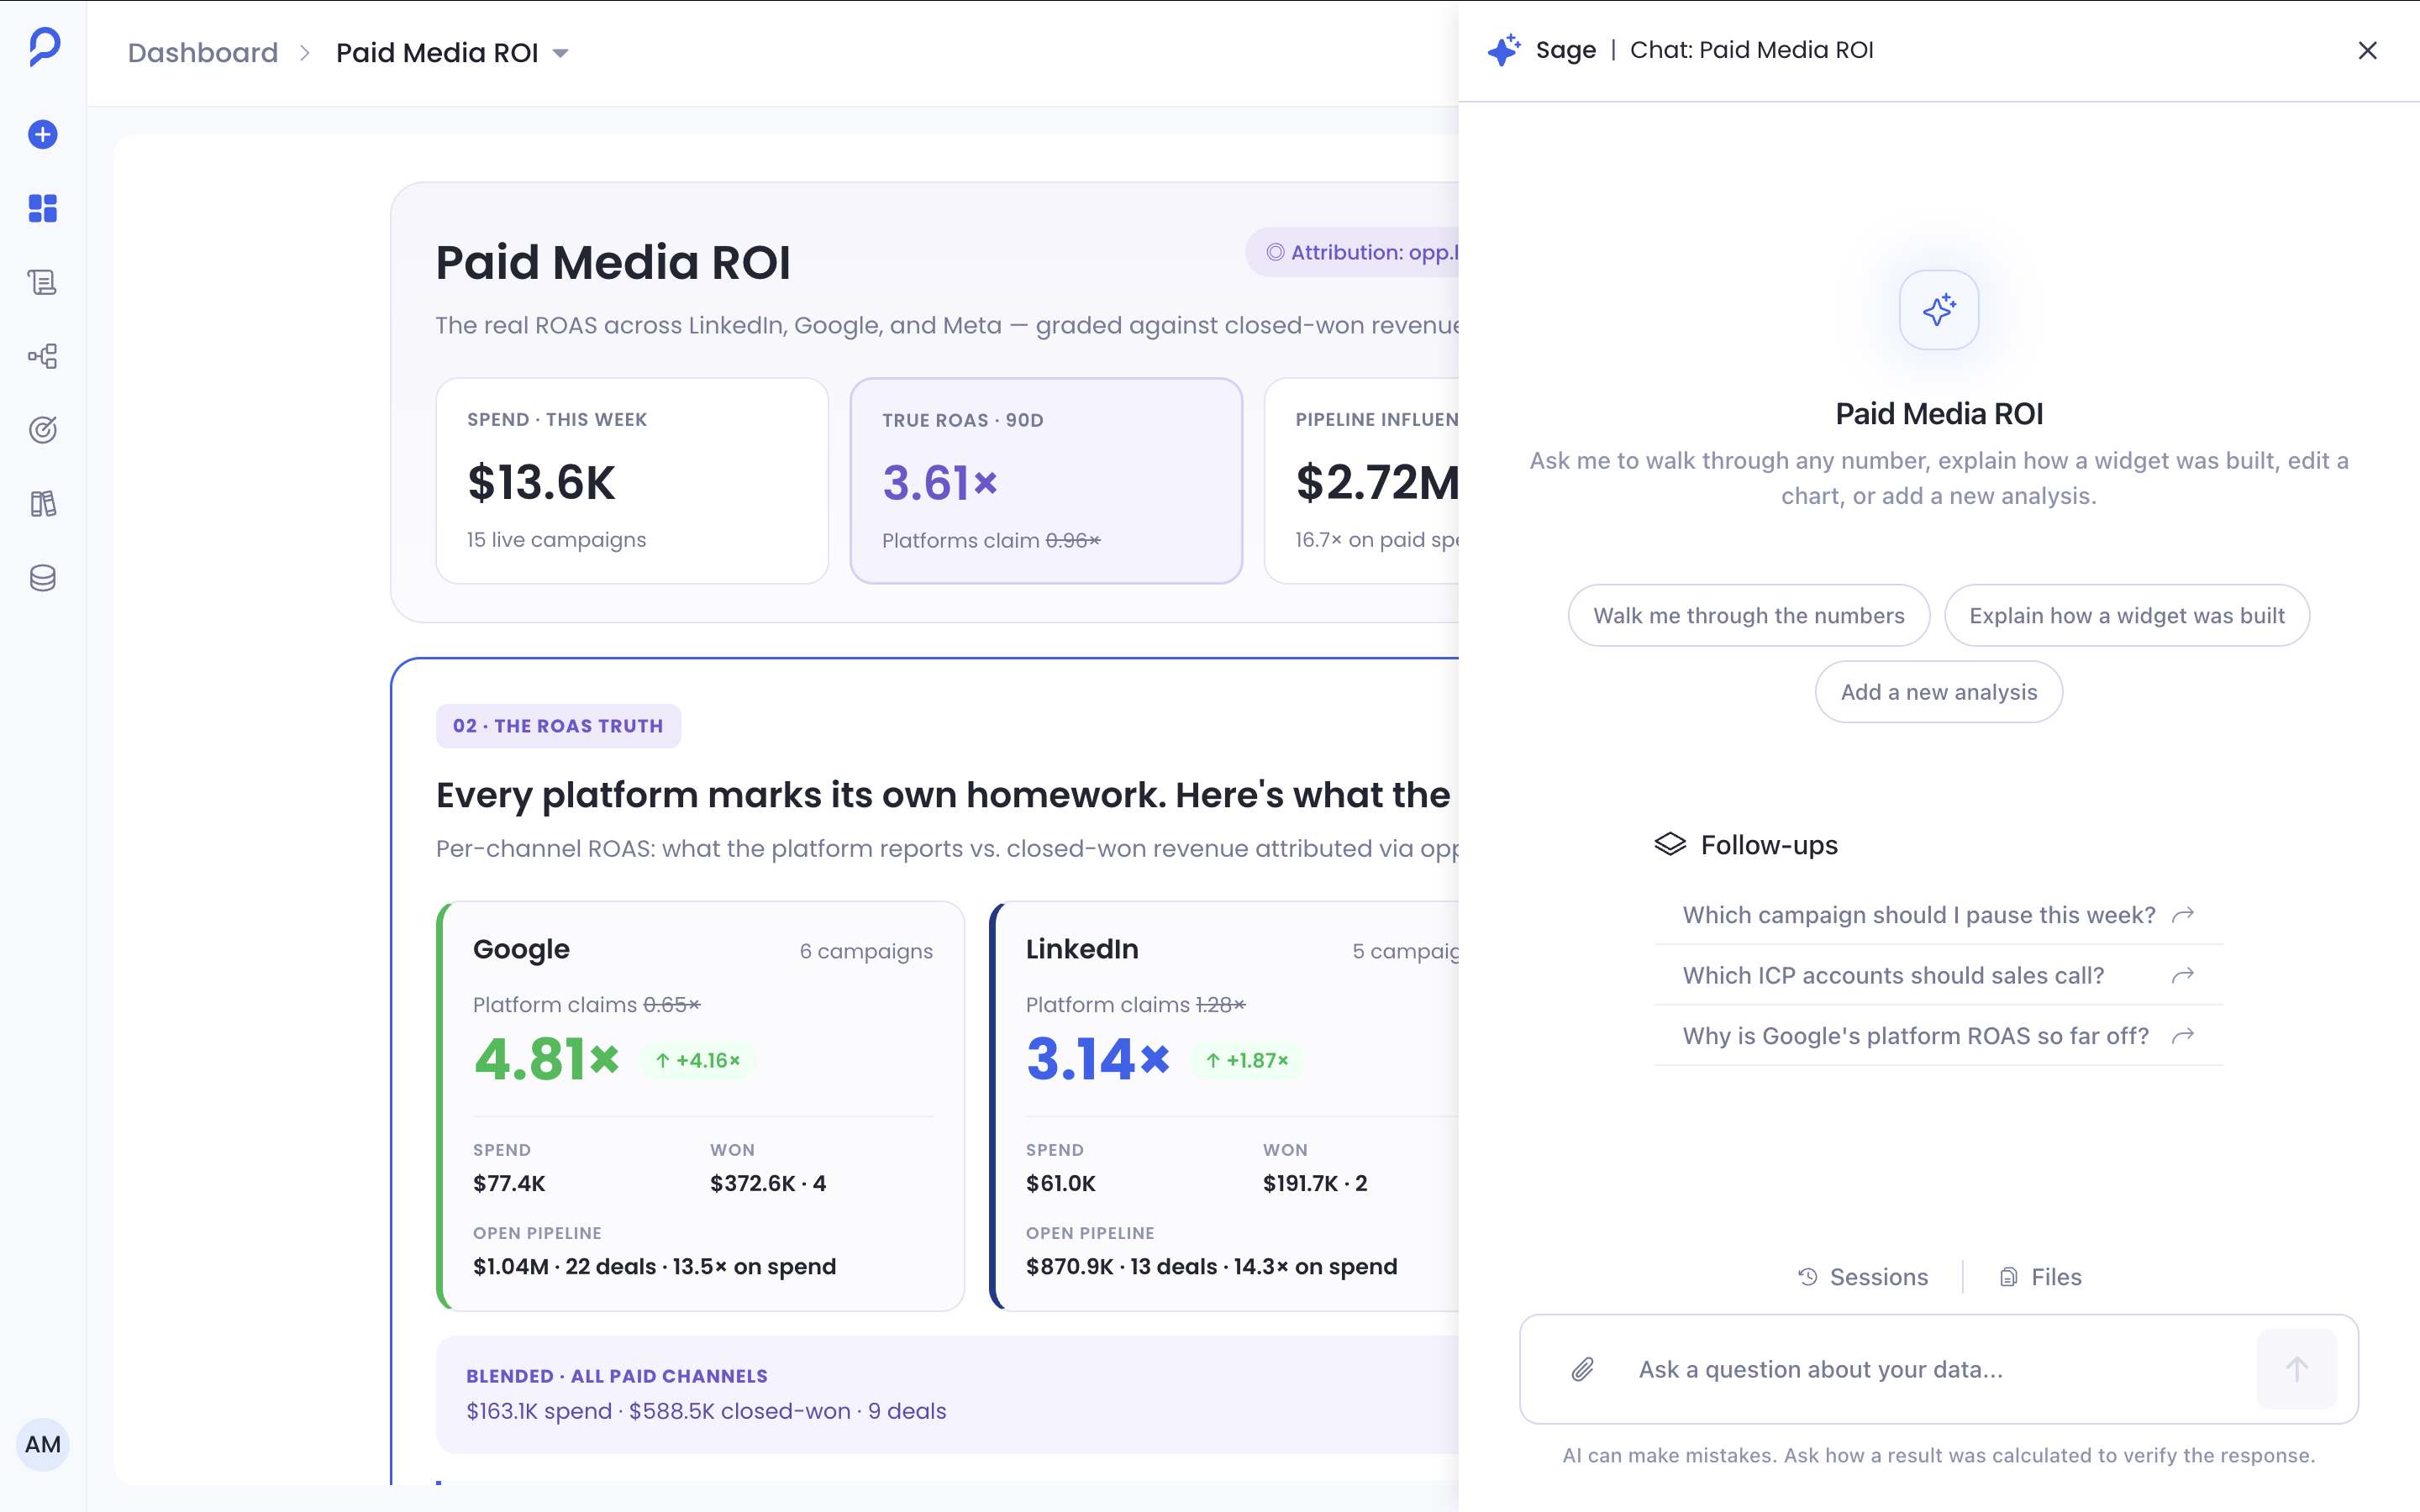
Open a dashboard and there's a Sage button on the top right. It opens a panel on the right with the same UI as the Sage homepage, so you can ask about the data and widgets and get a better understanding of what's already in front of you.
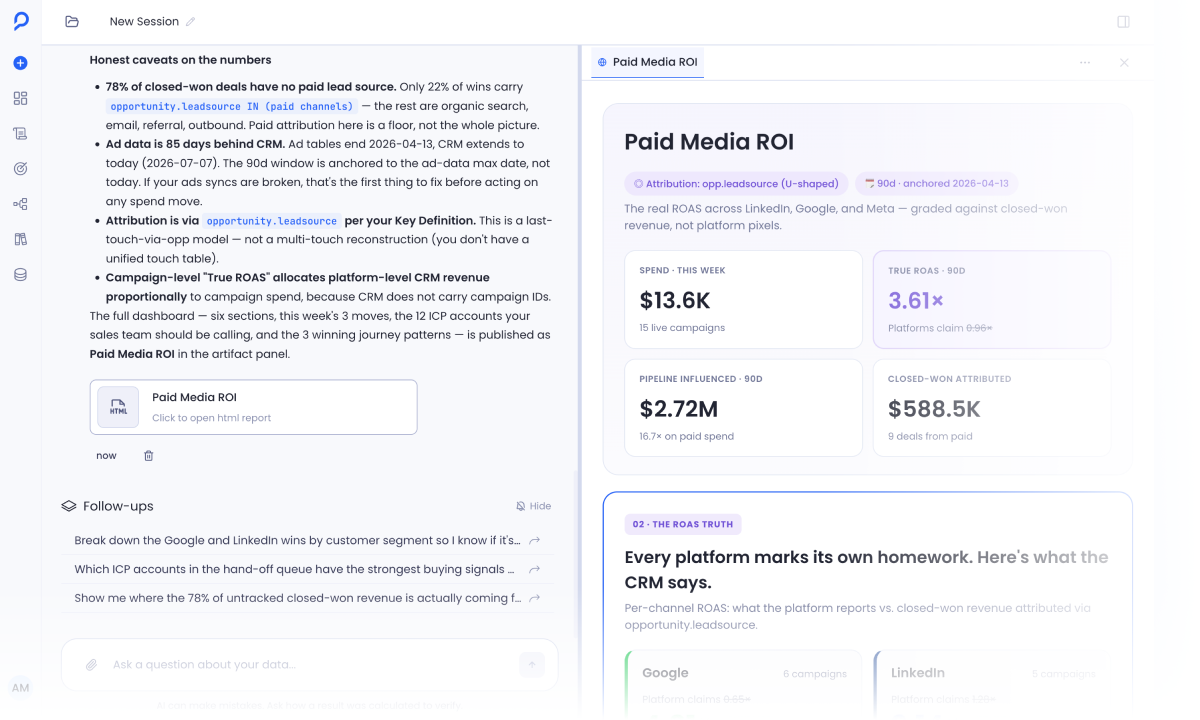
Sage keeps the same interaction model across the product while inheriting the context of the surface it is opened from.
A dashboard tells you what changed. Users still need to understand why.
The clearest example is a published dashboard. Once a dashboard is published, users still have questions about what caused a change, whether it matters, and what they should investigate next. Sage brings those questions into the same context as the dashboard.
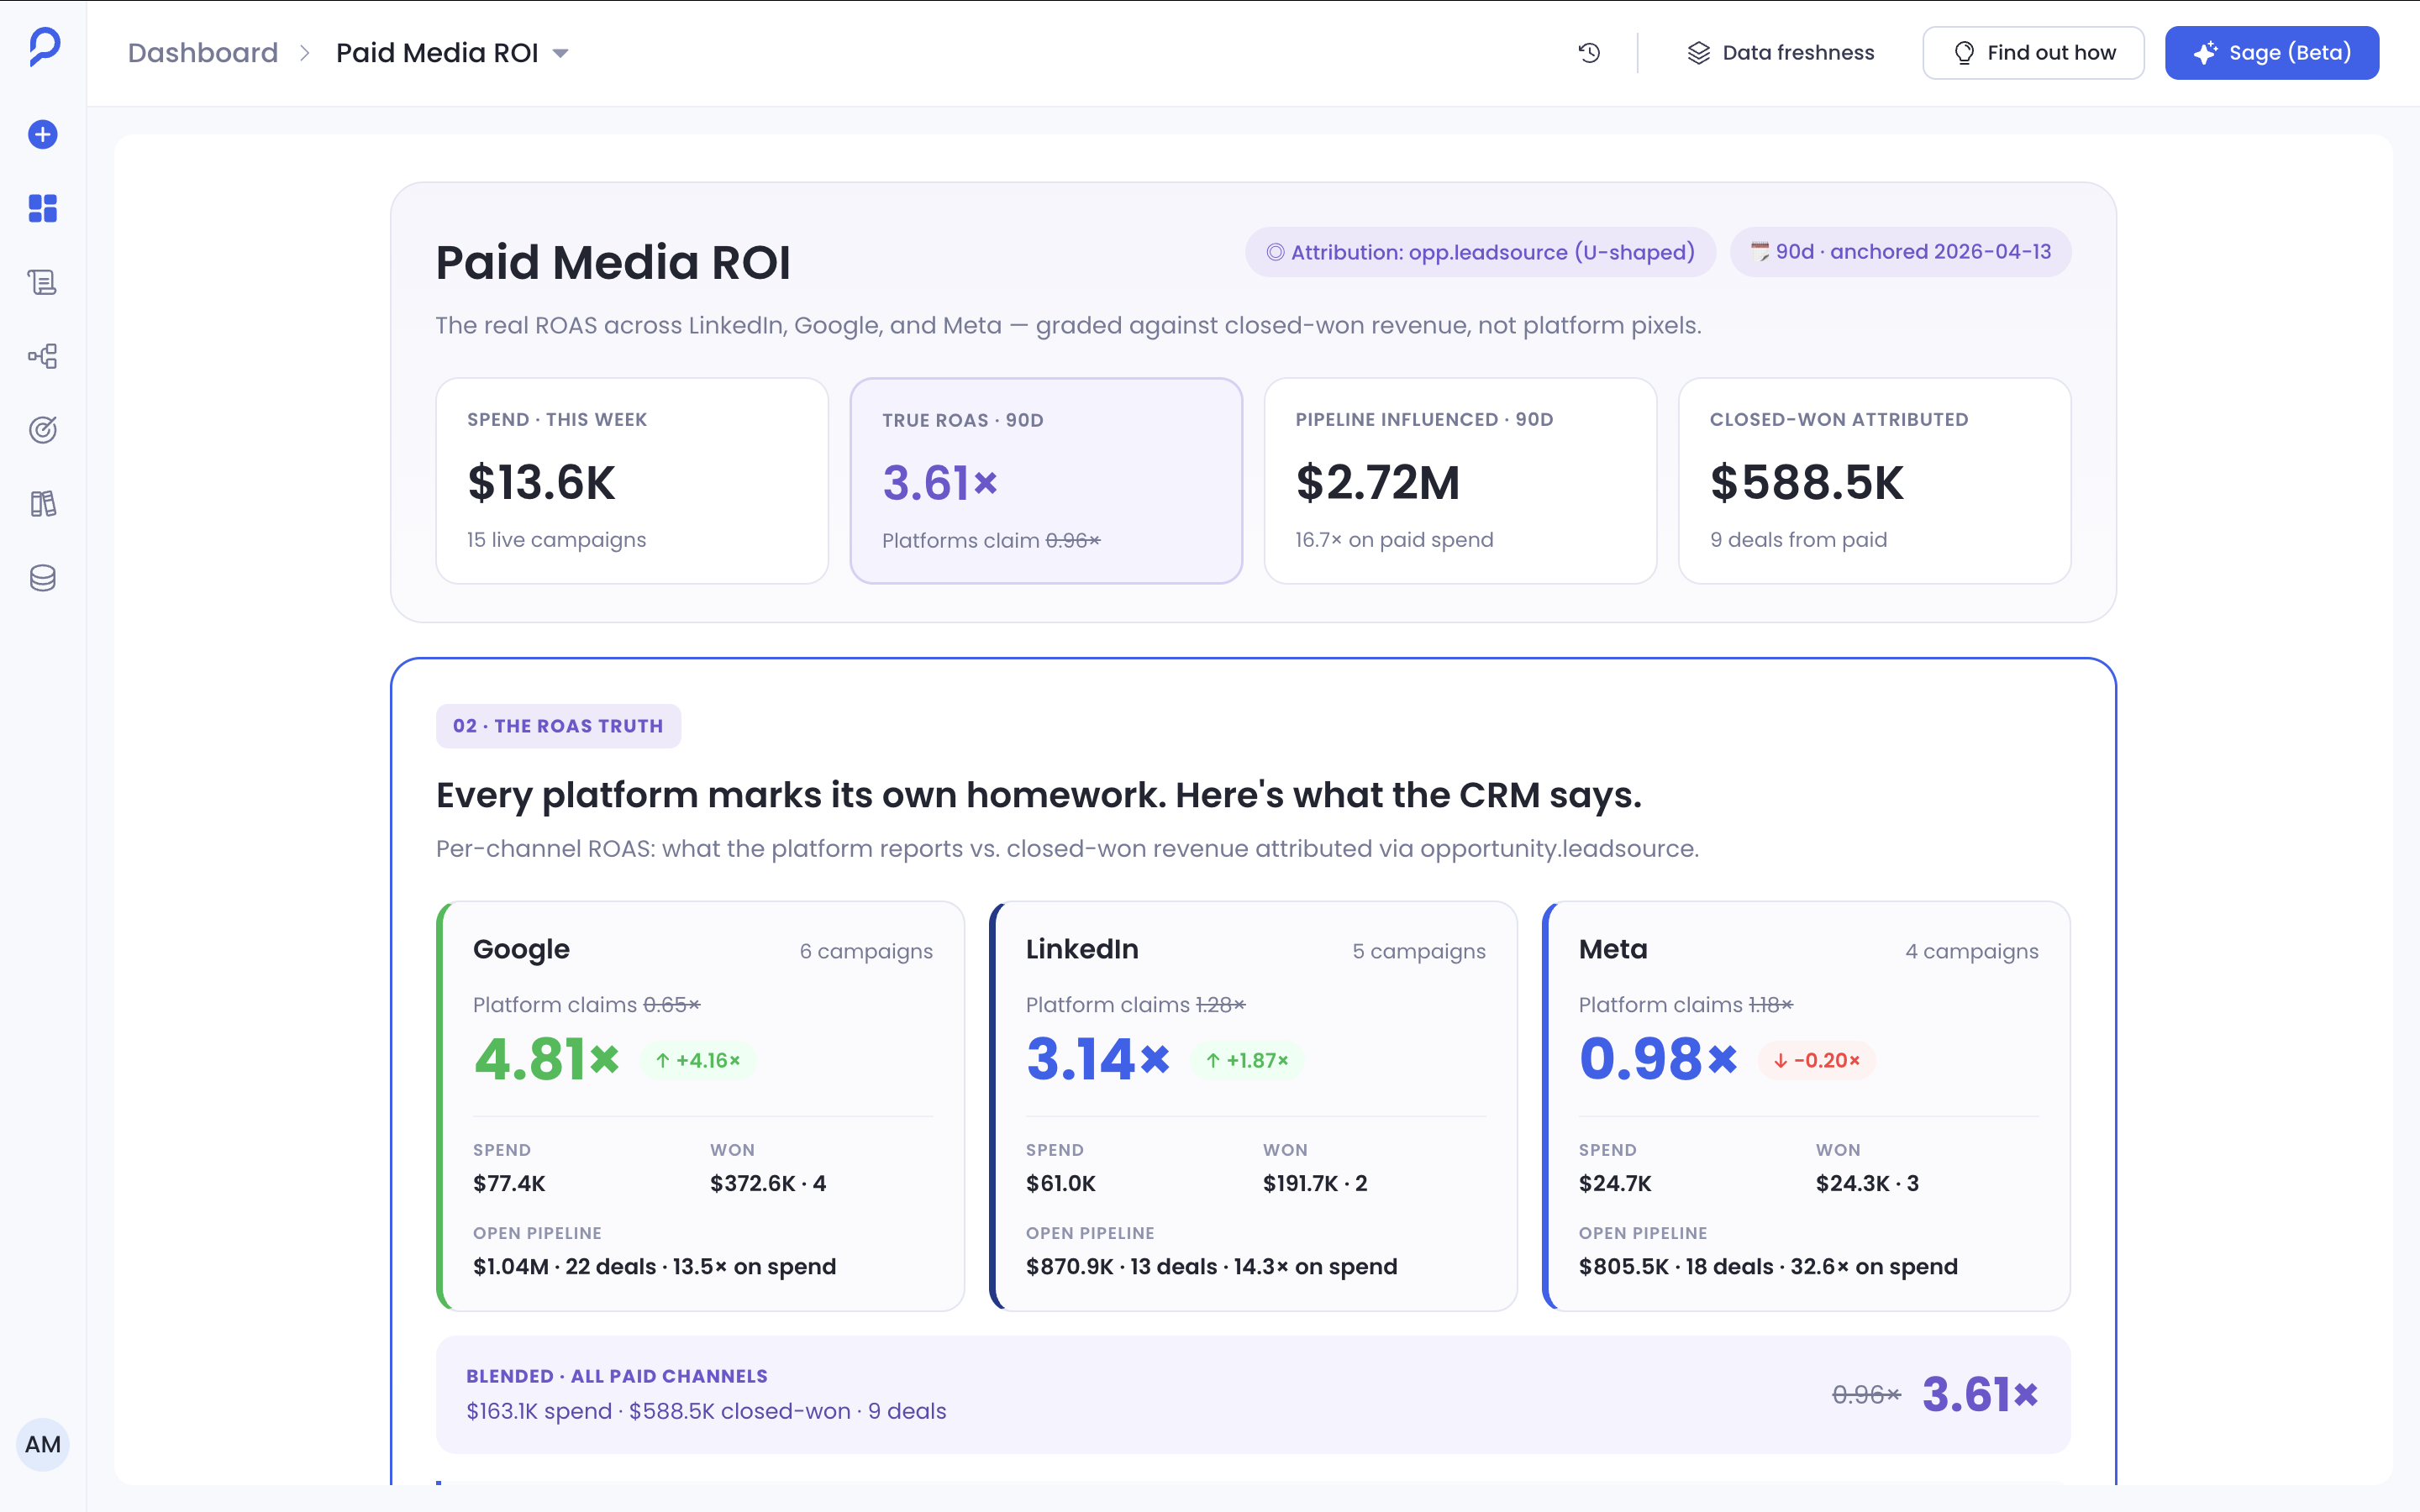
Before Sage
You'd have to ask an analyst to build another report, or wait for someone to explain what changed, before you could piece it all together.
With Sage
You ask the dashboard directly. The platform already built it for you, and now you can ask questions on top of that data and continue straight from there.
Where Sage fits
Sage comes after your dashboard is created and published. The dashboard gives users something concrete to investigate, and Sage is the way for them to ask about it.
When Sage opens from a dashboard, the dashboard stays visible beside it: dashboard on the left, Sage on the right, so you can see both and ask questions in real time. The dashboard is the user's source of context. Keeping it visible meant users could ask about a number without losing the filters, date range, or widgets they were looking at.
The conversation's context also locks to that dashboard the moment a question starts, which kept every answer honest about exactly what it was based on. The trade-off: change the dashboard mid-conversation and you start a new question, instead of Sage silently reconciling a context that already moved.
Designing answers for decisions, not conversation
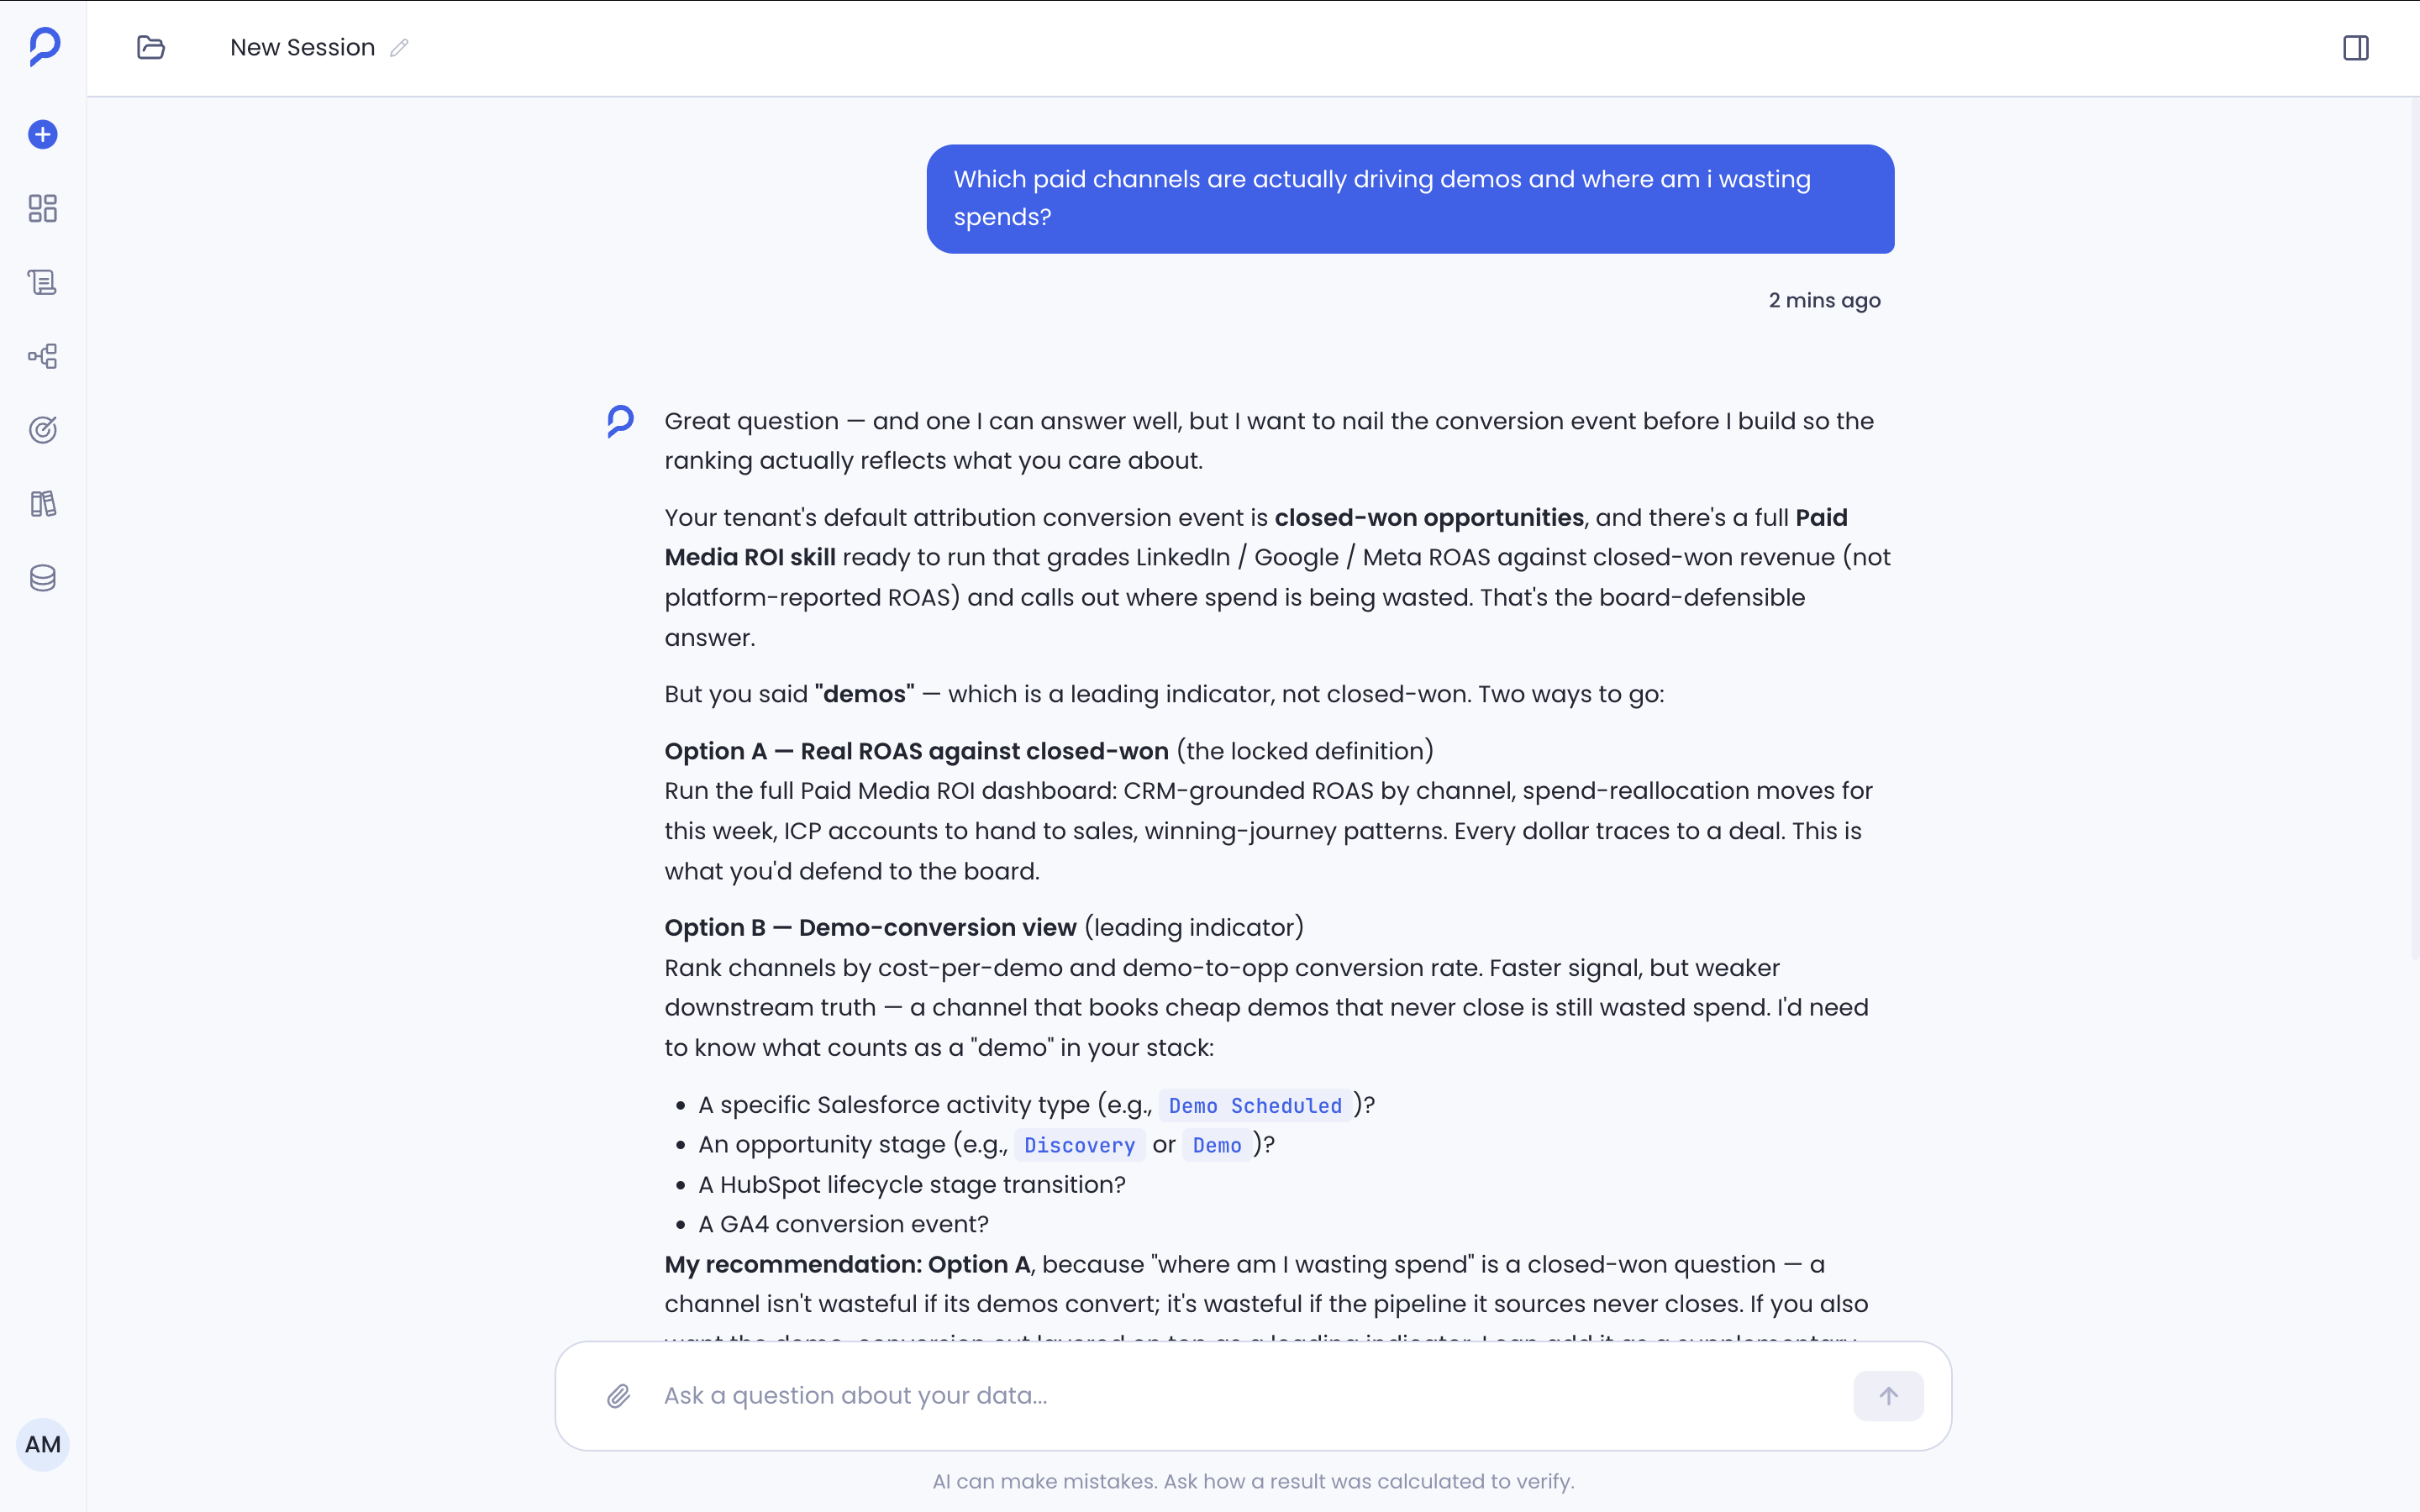
- 1Finding
- 2Evidence
- 3Recommendation
- 4Guardrail
Every Sage response follows the same order: what happened, what supports it, what to do next, and what to watch out for. A short chat reply works for small talk, but it doesn't give an analytical question enough to act on in one pass. A structured answer takes a little longer to read, in exchange for skipping the back and forth a shorter one would need. Every answer also ends with a set of follow-up questions, so you can keep asking or drill one step deeper.
Making AI answers verifiable
Sage needs to give users an answer without hiding where that answer came from. Before Sage answers, it shows the tool call it made, so users can see the source of truth their answer came from. The reasoning is always shown in plain language, and the technical execution is there inside the tool call when someone wants to verify the result.
Technical execution is hidden by default, because most GTM users need the finding, not the implementation. The cost is one extra click for technical users who want to verify the answer.
Designing for the moments between the answer
AI interfaces have more states than a static chat screen. I designed the experience around what happens while Sage is working, when it needs clarification, and when an answer cannot be completed. Brick by brick, I built the pieces for it: the user and Sage reply bubbles, and status states for connected, thinking, and disconnected.
I built the interaction before polishing the UI
The other big challenge for me was building the entire prototype to show stakeholders, inside Claude Code. Every component in it is one I designed in Figma and exported as a React component. It let me test how an answer streams in, how a clarification interrupts a flow, and how context carries across messages, things a static comp can't show.
Product and engineering reviewed that prototype before a polished Figma file existed. Once the interaction model held up, I refined the visual design and components in Figma.
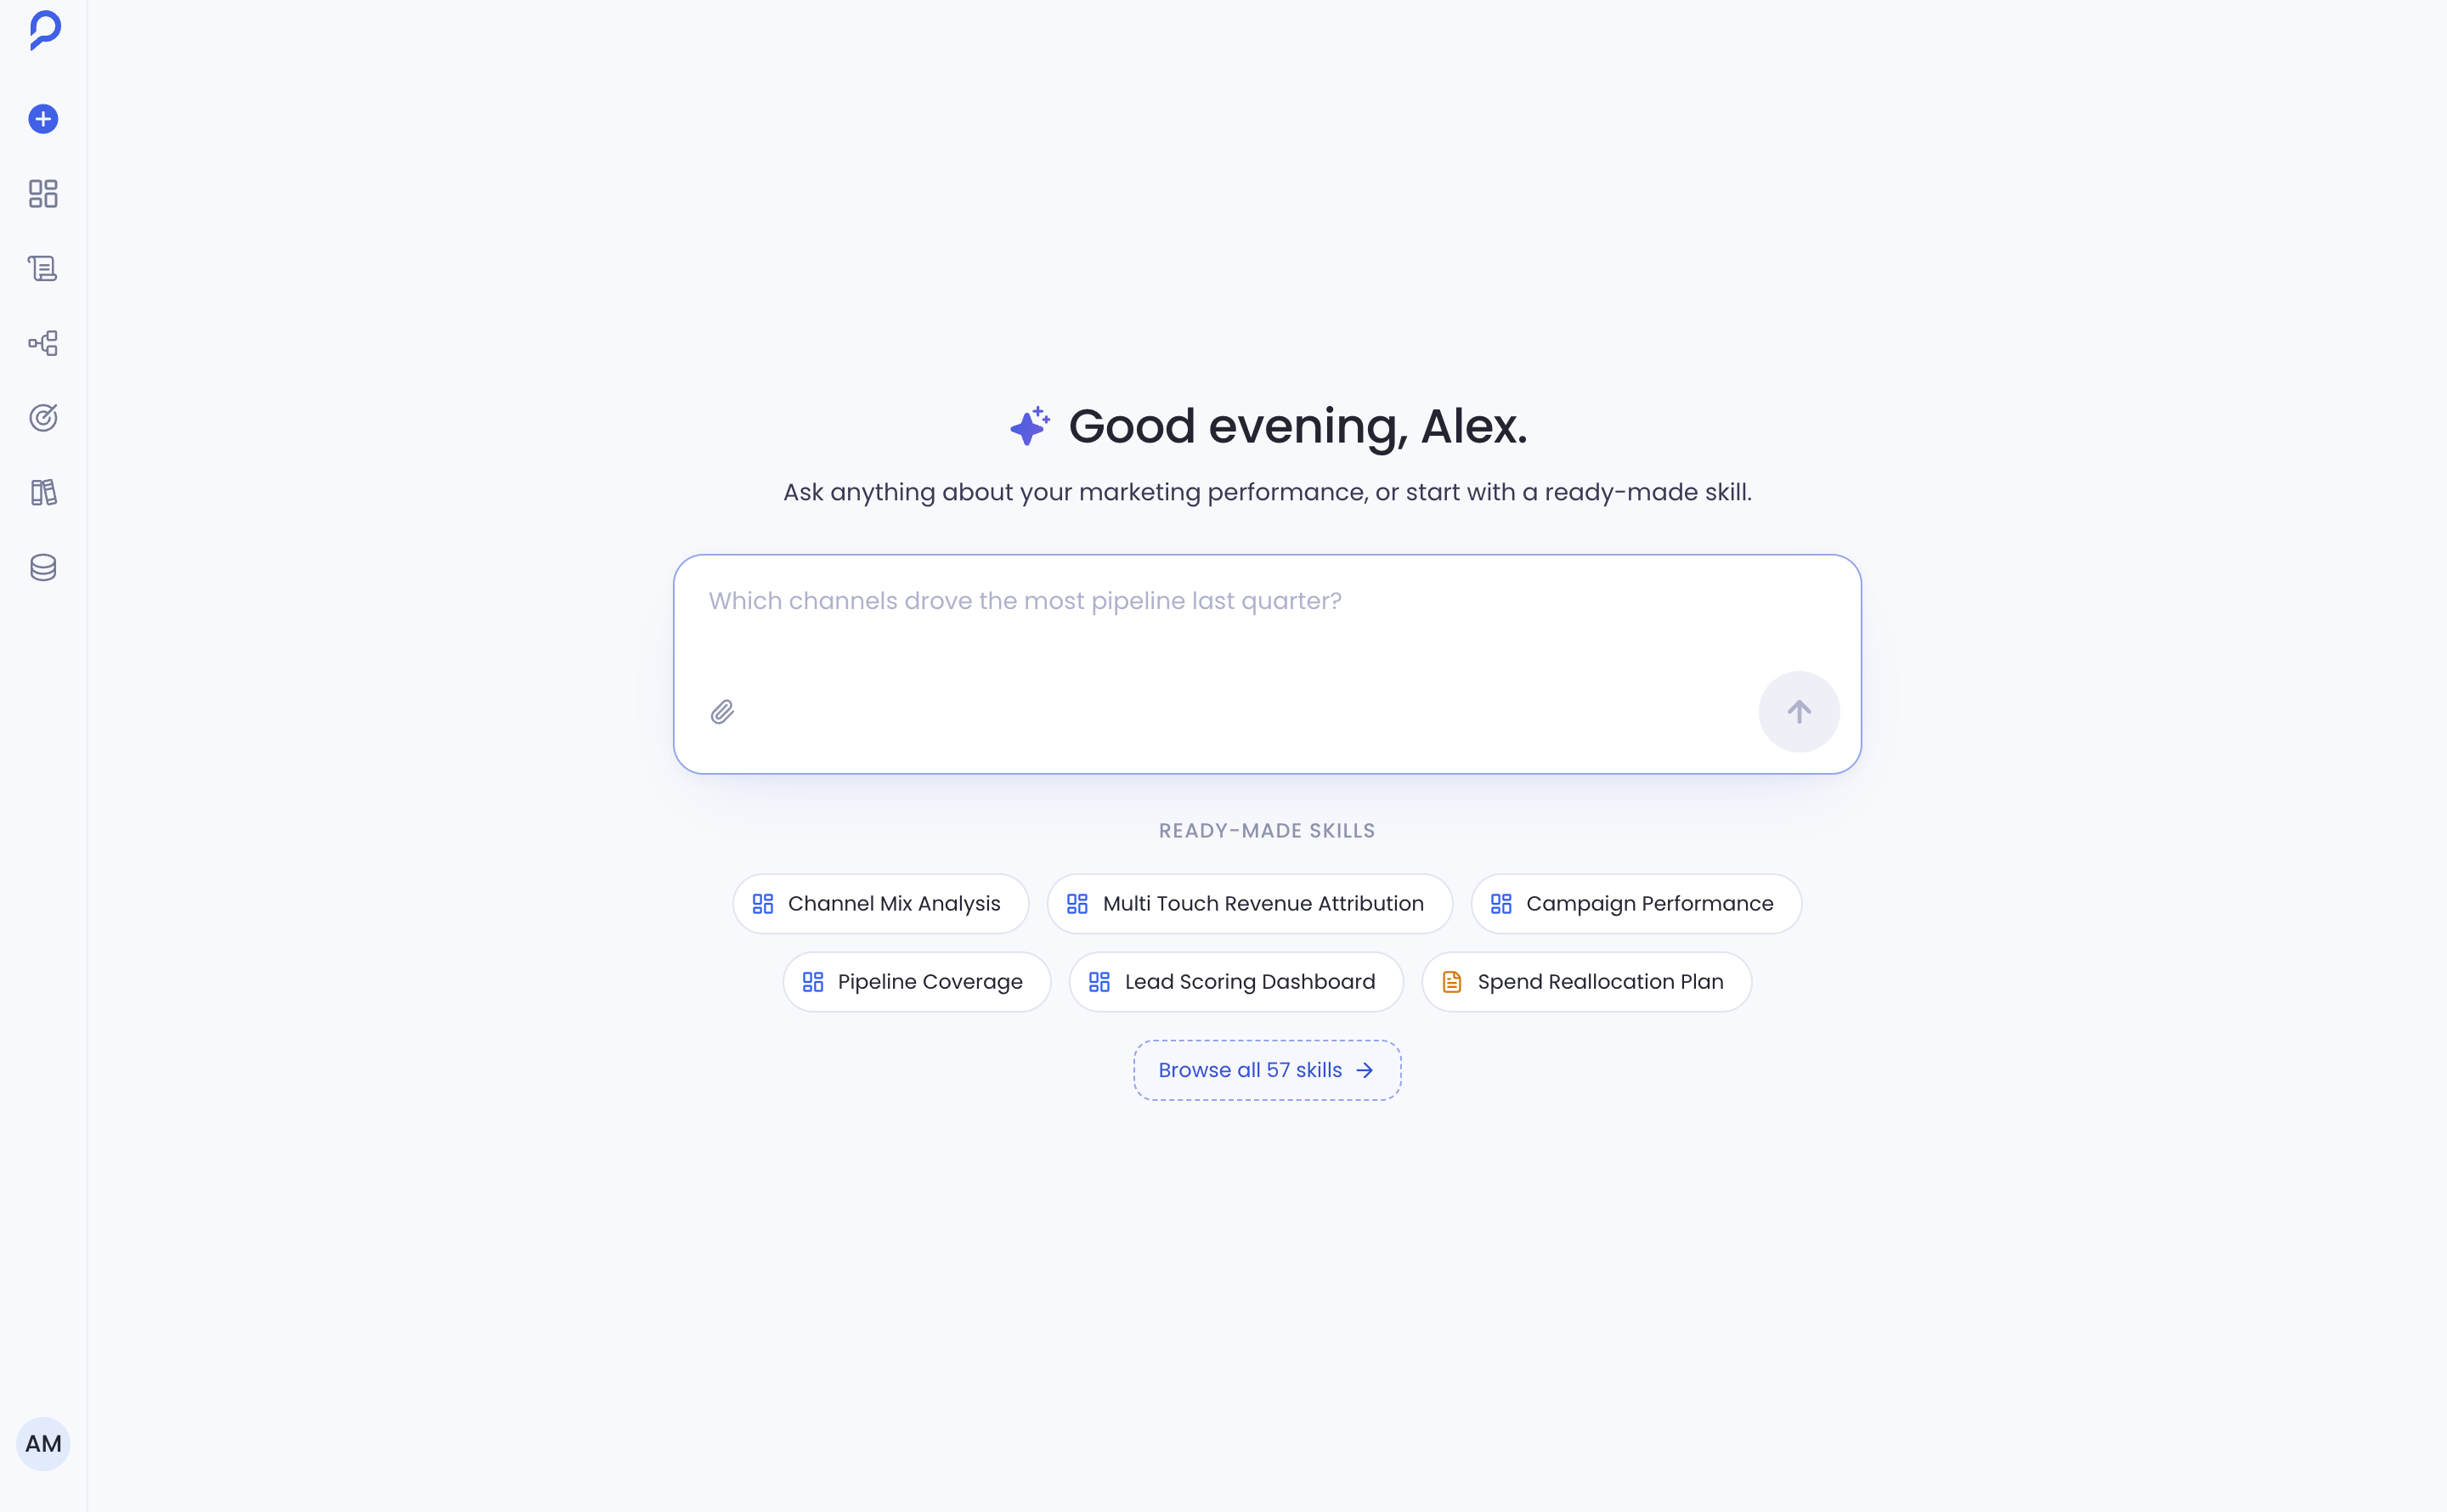
Outcome
Sage established a consistent conversational layer for Petavue's dashboard, reporting, and analysis workflows. For me, the work was taking a system full of technical context and turning it into something anyone can use in plain language. From here, Sage becomes part of Petavue's offering: a plain-language interface on top of its analytics.